We all love watching videos on Facebook. Do you know around 8 billion videos are watched daily on Facebook?
But still many complain that their videos didn’t receive the number of views and engagement they expected in the first place.
This brings us to the point where we should stop for a second and think about how many videos we upload on Facebook receive the same treatment.
Are they getting the right number of views? Or, why people are skipping your stories?
As a Facebook video marketer, you should think about all these questions. But who will answer all of these questions?
The Facebook Metrics.
Yes, you read it right.
Understanding the Facebook video metrics facilitates you to get a better idea of how well your audience is responding to your video content. It allows you to measure the results of your paid campaigns accurately which also helps you in understanding if your investment going in the right place.
These insights can be very useful as you can use them to boost the engagement, reach, and ROI of your next video marketing campaign.
When it comes to Facebook video metrics, what are the most important ones to monitor? The metrics you should be tracking for your brand will be laid out in this piece.
Facebook Video Metrics – how to find them?
There are a few methods through which you can access the Facebook video metrics of your organic posting.
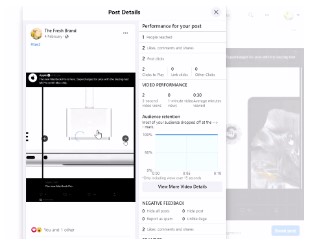
To view the performance of a post, select a metric from the drop-down menu under each post. This will give you a more in-depth look at all of the video’s metrics.
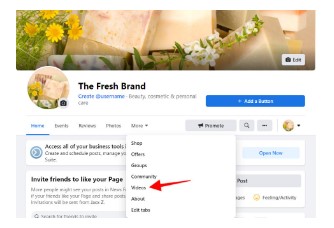
You can also view these metrics from your video library. Go to the ‘More’ button and select ‘Videos’. Now, you can see all the videos you’ve posted to date and choose the one you wish to analyze.
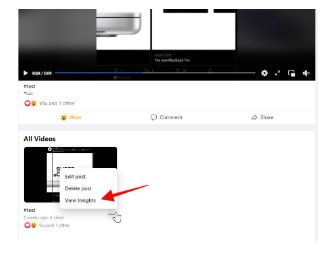
At the top of the page, you’ll see all your most popular videos. Select the video you wish to study by clicking on the “…” button underneath the video. Then, click “View insights” to bring up the metrics page and get more information.
Your Page Insights will also provide you with access to additional video data on Facebook, such as Facebook Story stats and Facebook Live metrics. The Facebook Ads Manager gives you complete visibility into the performance of your video ads.
P.S: We at BuzzFlick make different animated social media videos. The services we offer include cel animation, whiteboard animation, 3D animation, and 2D animation services. Click here to learn more about the services we offer for your next Facebook video.
What are the Best Video Metrics to Track on Facebook?
There are no rules to follow when it comes to how well your Facebook videos perform. Depending on your business, your audience size, and your previous video performance, “good” can be defined in a variety of ways. For a company with 10,000 followers, a view count of 1,000 can be considered poor. However, for a company with 2,000 fans, it’s a respectable figure.
Use your own Facebook video data as benchmarks to see how you’ve improved over time.
Video Views
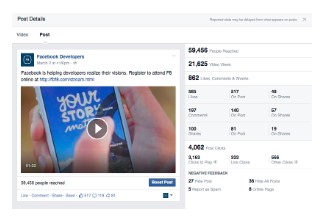
This indicator shows you how many times your video has been seen. Because it reaches a far wider audience, the number of people who have seen your video on Facebook is a good indicator of its success. In other words, you can see how many people saw your video in their Feeds and how many of those individuals viewed it.
Even a few seconds of viewing time is counted toward this Facebook metric’s total number of video views. That is, it doesn’t provide you with a complete picture of how you performed in the video. A benchmark for Facebook video view rate, on the other hand, might be useful in campaign evaluation.
Does Facebook count re-watching as a new view?
Facebook only counts unrepeated seconds of viewing as a view count in order to prevent skewing the statistics. To put it another way, Facebook will only credit one view for each time the video is re-watched.
Engagement Rate
Facebook videos such as in-feed videos, Stories, and Live, should be measured for engagement. It tracks how often individuals have interacted with your video content through likes, comments, and shares.
The native analytics tool for Facebook Stories analyzes all of the engagement data from the previous 28 days. It counts all the engagement actions such as reactions, stickers, swiping up, profile touches, replies, and shares.

This gives you a sense of how well your message connected with the intended audience. What are the most popular sorts of videos? As a result, Facebook video engagement metrics can act as benchmarks for your video content strategy on Facebook.
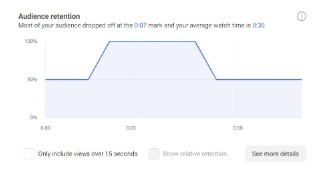
Retention of the Audience
This Facebook video metric lets you know when your video’s audience starts to dwindle. As a result, you’ll have a clear idea of how well your films did in capturing and retaining people who actively viewed them. You’ll be able to tell exactly where in the film they lost interest, too.
P.S: If you want to retain the attention of your audience for a long time, then go for animated videos. Check out our list of best whiteboard animation companies for more help.
Negative Feedback
Is your video getting bad feedback from viewers? Receiving negative feedback can be caused by various reasons such as reporting posts as spam, hiding, or unlinking/unfollowing your page. Tracking this metric is critical since it reveals poor content that is causing your followers to lose interest.
Videos with a lot of critical feedback might put your brand’s reputation in jeopardy in numerous circumstances. . So, it’s important to quickly evaluate them and get to the bottom of the problem.

Top Audience and Top Location
Demographic information about your viewers, such as their location and primary demographic, can provide you with a better understanding of your intended audience.
These indicators help you identify the audience you should be aiming your marketing efforts at. They also provide insight on how to best craft your messaging and marketing strategy.
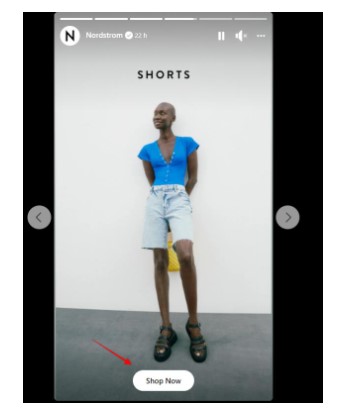
Swipe-up Actions
This metric is only applicable to Facebook Stories. Swipe-up actions let you know how many times a link or action button in your Stories was swiped up by a user. It’s a good statistic for determining how effective your Stories are at driving conversions and how users may swipe up to “Shop Now.”
Saves
It’s also a good idea to keep an eye on the amount of Saves your Story video has received from individuals who have added it to their Facebook collection.
Stories with high engagement rates are a great way to see how much value they’re providing to the people reading them.
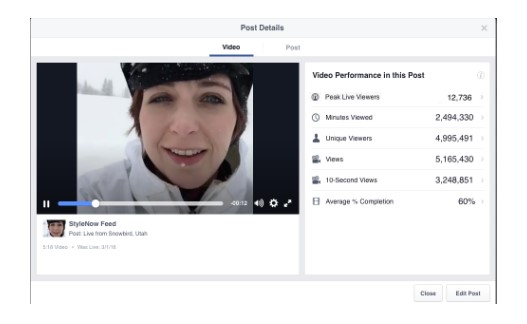
Peak Live Viewers
By using this metric, you can see how many people were watching your live video. Viewers may see a graph of their number fluctuating throughout the live show by expanding on this measure. As a result, you’ll have a better notion of when viewers begin to dwindle.
If a live is going too long, you can use this information to determine whether or not viewers are becoming restless. It could be a sign that you should make changes to your broadcast schedule so that more people can watch the entire episode. Content quality might potentially be a factor in this measure.
Average Completion Rate
The average completion rate gives you an idea of how many viewers stuck with your live video all the way to the conclusion.
Your live broadcasts may not be entertaining or well-executed if the average completion rate is low. Even if your audience was too busy to see the whole thing, you might have aired at the wrong time.
For this low completion rate, you will need to figure out why and experiment with ways to make your live broadcasts more interesting.
Page Growth
You’ll observe an increase in your follower base as you produce more interesting videos.
Use Facebook video benchmarks to see how your content is affecting the number of people who like your page.
After a live video session, Facebook allows you to see the number of followers you got on your page. With this stat, you can see how your live broadcasts are doing in terms of getting people to “like” your page and learn more about how to improve them.
Engagements with Advertisements
You should monitor your ad engagement numbers if you’re conducting Facebook video ad campaigns.
Does your video advertising get a good response from the public? If you want to get the most bang for your buck from your advertising dollars, you need to know the answer to this question.
When it comes to watching your video advertising, how much time do they take? Were you surprised by how many times potential customers contacted you after seeing your ads? Using the Ads Manager, you may see these important video ad stats.
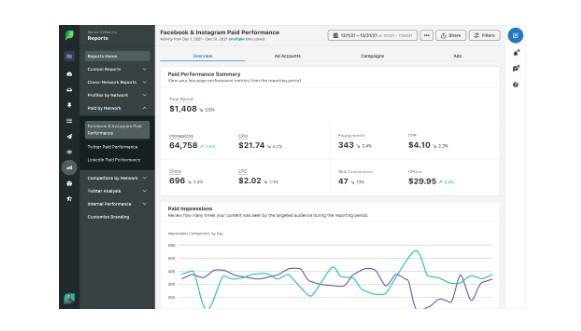
In addition, you can utilize the Sprout Social Facebook Paid Performance Report to obtain a more in-depth look at the performance of your video ads on Facebook.
This offers you a general idea of how many people saw your advertisements. It’s also possible to see how many people clicked on your ad and how many people converted to customers online.
As a result, you can utilize this information to better evaluate the success of your campaign and identify areas in which you can improve your Facebook video ad performance.
Ad Cost (CPE, CPM, CPCon, CPC)
It’s also important to keep track of how much you’re spending on Facebook video advertising. A full breakdown of your ad spend is available in the Facebook Paid Performance Report. When you’re comparing your ad budget to various performance measures, you can see where you stand.
As an example, the cost per impression, cost per engagement, cost per click, and cost per online conversion may be viewed on the dashboards. All of these measures are essential if you want to have a clearer image of your advertising expenditure and, ultimately, the success of your campaign.
Start Tracking Your Facebook Videos Growth
It is just a matter of time before video marketing becomes as prevalent as it is now.
Videos on Facebook are proving to be a valuable marketing tool for businesses. Around 54 percent of marketers believe that video is the most effective content format for reaching their social media goals.
As a Facebook video marketer, you cannot afford to lose out on the most important performance information.
Using the important Facebook video metrics we discussed above, make sure you’re monitoring your progress on a frequent basis.
Need Help with Your Facebook Videos and Marketing? Read This Out
You should know these metrics will only work if the content and quality of your videos are top-notch.
Since we know platforms like Facebook has become over-crowded with video content, therefore, to stand out among the crowd has become pretty challenging.
However, you can still win this game by making unique, interesting, and engaging type of video content. You can take help from experts like any video production studio that offer social media video marketing services. You can explore our list of top video production companies in NYC for this purpose.
Moreover, if you want to make your videos more interesting, you can simply go for animation. This video style has gained popularity in the last few years. Moreover, the price of an animated video is much less when compared to a full-fledged live-action video.
The ball is in your hand. Just remember to take all the above Facebook video metrics into consideration before starting your next video marketing campaign on Facebook.


